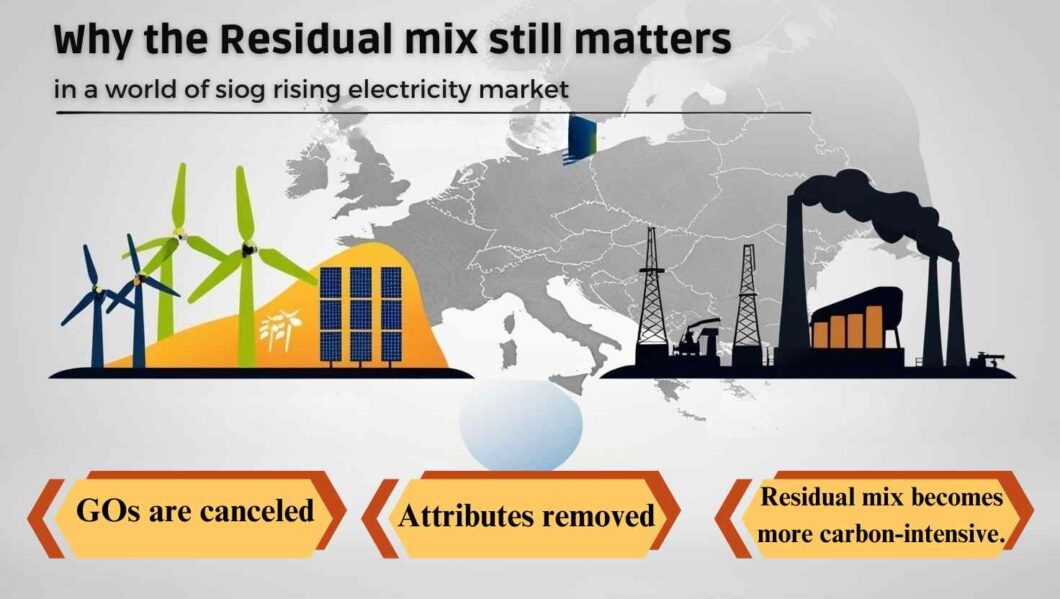
As Europe accelerates its energy transition, market mechanisms like Guarantees of Origin (GOs) have become key to tracking and verifying renewable electricity use. In 2024, GO demand has continued to rise — reflecting growing corporate commitments to sustainability and consumer appetite for clean power. But while GO cancellations confirm rising green electricity claims, one often overlooked metric tells a deeper story: the residual mix.
Rising Cancellations: Clear Demand Signal
The latest data from the Association of Issuing Bodies (AIB) shows that in 2023:
- Over 900 TWh of GOs were cancelled across Europe
- Norway alone issued over 150 TWh of GOs — matching almost its full national production
Preliminary 2024 figures suggest further growth, as more companies purchase GOs to meet Scope 2 emissions reporting under the market-based method.
Cancellation = usage. When a GO is cancelled, it has been claimed by a consumer to prove renewable electricity usage.
So why do we still need the residual mix?
🔎 What Is the Residual Mix?
The residual mix represents the electricity mix left over after all cancelled GOs are subtracted. It reflects the energy profile for consumers who do not purchase GOs — such as households or businesses that use the location-based method for carbon accounting.
Think of it this way:
The GO system lets consumers “claim” green electricity.
The residual mix shows what remains for those who don’t claim anything.
How the Residual Mix Is Calculated
The residual mix is calculated annually using this method:
- Start with national electricity generation by source.
- Subtract GOs that were cancelled, both domestically and those exported.
- Add GOs imported but not yet cancelled.
- Adjust for issuance and cancellation timing.
- Result: the residual mix — assigned to all non-GO consumers.
Each country publishes its own residual mix, and AIB provides the European residual mix.
Source: AIB
A Norwegian Paradox
Despite Norway generating over 90% of its electricity from hydropower, its residual mix often tells a different story.
In 2022 and 2023:
- Most GOs were exported to countries like Germany, the Netherlands, and Austria.
- The residual mix in Norway dropped to 10–20% renewable share.
- The carbon intensity of the residual mix increased — making it comparable to the European average.
This highlights a key fact:
If you don’t purchase GOs in Norway, your electricity mix may look much less green than you’d expect.
June 2025: A Key Moment
In June 2025, the Norwegian Water Resources and Energy Directorate (NVE) will publish the residual mix for 2024. This will provide valuable insight into:
- How much renewable electricity has been claimed via GOs
- The carbon intensity faced by non-GO consumers
- The net effect of growing market-based claims on the wider system
This data will confirm whether rising GO cancellations are making the residual mix “dirtier” — a phenomenon that incentivizes more actors to join the GO market.
The Bigger Picture: Residual Mix and Energy Transparency
The residual mix plays a crucial role in:
- Scope 2 emissions reporting (location-based method)
- Guaranteeing the integrity of green claims
- Revealing market pressure on consumers without GOs
- Preparing for 24/7 hourly matching systems and granular GOs
As energy systems evolve, hourly residual mixes will become increasingly relevant — showing not just “how green” but also when renewable energy is available.
Final Thoughts
Rising GO demand is a strong signal of voluntary climate action and market evolution. But without the residual mix, we miss a key part of the picture.
The residual mix is the mirror of the GO system — showing who is left behind, and how the benefits of renewable energy are distributed.
As we move toward more transparent, granular, and just energy systems, the residual mix will remain an essential tool — not only for policy and accounting, but for ensuring trust and fairness in the clean energy transition.
Lorem ipsum dolor sit amet, consectetur adipiscing elit. Ut elit tellus, luctus nec ullamcorper mattis, pulvinar dapibus leo.
Source: AIB
